
Isobars are the little lines on weather charts that tell you what the barometric pressure is across the landscape. Isobars are the demarcation line where the pressure will be the same along its entire length.
Wind travels along the length of the isobar, and the closer the isobars are, the stronger the wind will be. Wind travels counter clockwise around low pressure systems and clockwise around high pressure systems. This means that the wind wil travel to the left or to the right along the length of your isobar depending on the location of the high or low pressure systems around it.
While wind speed is estimated based on the proximity of one isobar to another, there are subtle variations based on line curvature. We have all had those days when they forecasted wind but it was dead calm, or they forecasted light winds and you needed to reef all the way down! What happened?!
The answer is simple, the isobar curved in your area and altered the wind speeds. If an isobar curves inward, creating a point that the wind will whip around, the winds will be faster. If the isobar curves outward, creating a divot in itself, the winds will calm down as the transit this area and give you much calmer winds than expected.
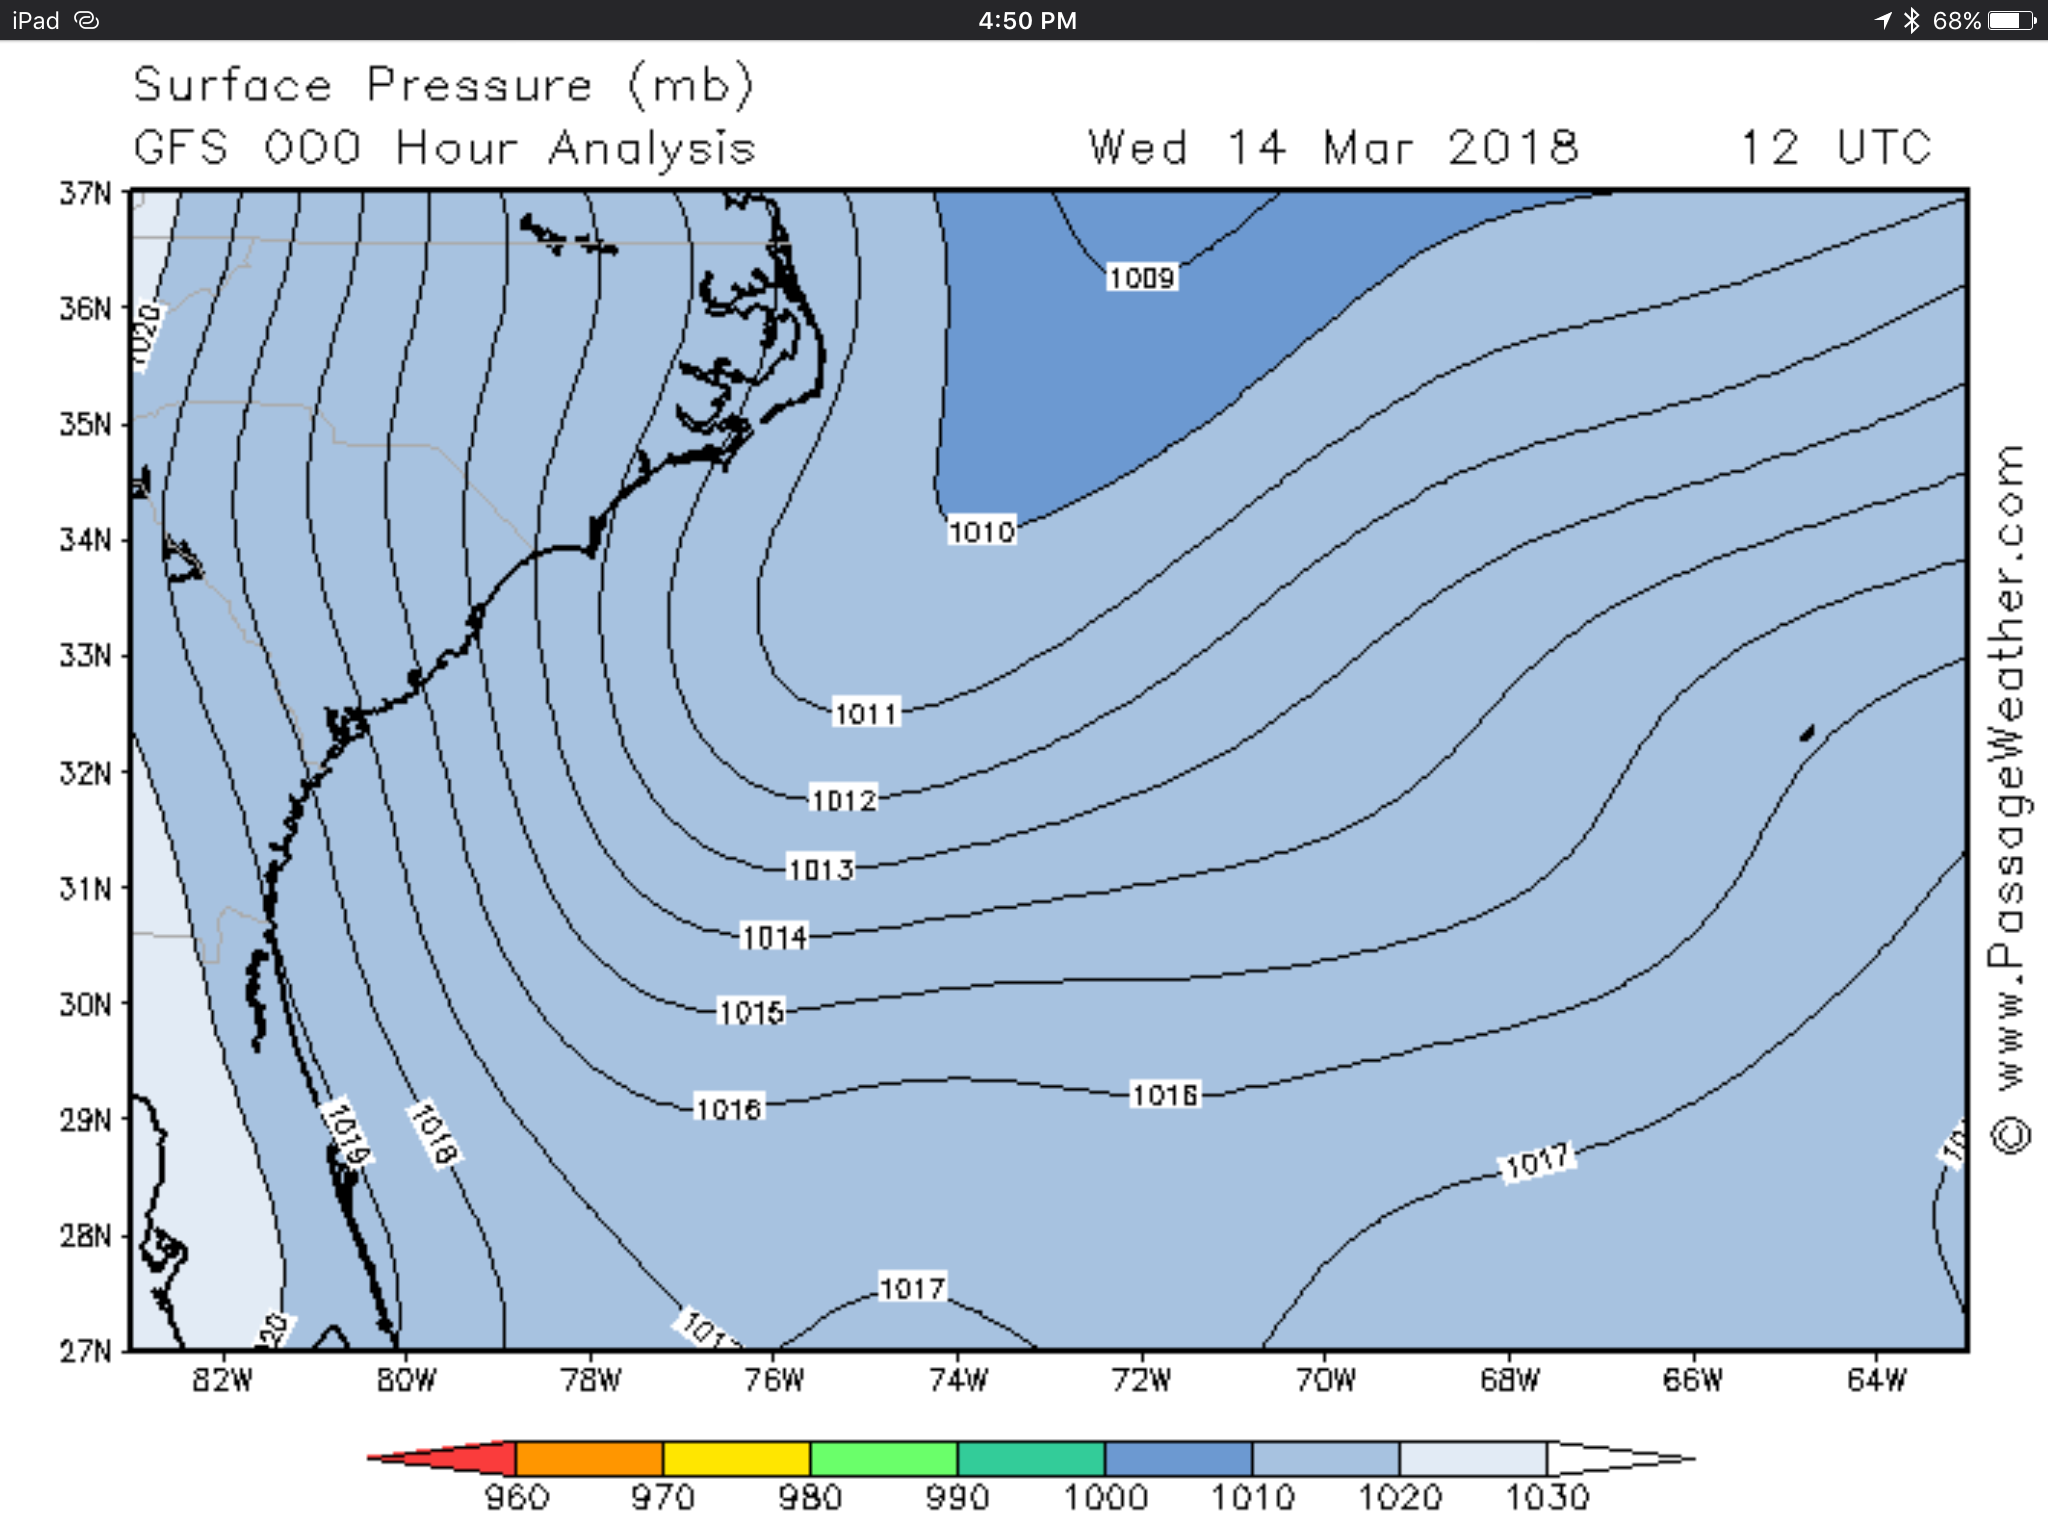
These isobars are extremely spaced out. There is considerable distance between each millibar of air pressure. This would tell you that the winds will be light in the entire area. Since the top of the screen has a low pressure center, you know that the winds will be moving counter clockwise or from left to right on this map. On the bottom left, you can see a high pressure area, so its winds will move clockwise or from left to right on this map.
Now, the 1010 line makes a pronounced point, so the winds in this area can be expected to be rather higher than the surrounding areas. The 1017 line at the very bottom near 75W makes an outward turn, so the winds here can be expected to be even slower than the surrounding areas.

Looking at the windbarb map, we can see that the winds near the point of the 1010 line are stronger, and the winds just above 75W are rather slow.

Looking at a global map of the Atlantic Ocean, you can see a high pressure system in the middle of the ocean and two low pressure systems at the top corners.
The high pressure system in the middle is called the Azores High, and is a famous pressure system that remains constant through most of the year. This will generate a clockwise rotation of wind around it.
Each low pressure system in the top corners will generate a counter clockwise rotation of wind.
The intensity of the wind will be caused by a few factors. First the high pressure area has widely spaced isobars, so the winds here will be light. The low pressure areas have very close isobars and a very drastic change in pressure from outside to inside. This will generate a very powerful wind as you approach these areas.
The second thing affecting the wind speeds will be the curvature of the isobars. The high has relatively long and straight isobars, so the winds will be rather consistent. The low pressure systems have very tight curves, especially towards the centers. This will amplify the speed of the wind and create an insane storm!

You can see the high pressure area is rather calm while the points and the centers of the low pressure systems are very intense.
Learning to read the isobars will allow you to better interpret weather data received offshore via weather fax where the image is not always clear and the graphical display leaves much to be desired.

The quality of the image depends on the quality of your signal and receiver. If the unit is not perfectly tuned, the image will be skewed. If you don't like the way your image looks, too bad! The next transmission is in 6 hours for you to try again!
Learning to read weather maps and isobars will be an invaluable skill when cruising and you are forced to be your own weather forecaster.
